Growth & Marketing
Growth & Marketing: How to Diagnose Growth Before You Scale It
By Saurav Mishra · · ~14 min read
One of the easiest mistakes in growth is declaring victory too early.
Cost per click falls. Signups rise. Revenue jumps after an offer. A channel reports a strong return.
All of those can be good signals. None of them proves that the business has become healthier.
If the new users activate less, retain worse, require heavier incentives, generate weaker margins, or would have converted anyway, a local metric can improve while the growth system gets worse.
That is the problem this guide is built around.
It is not another list of growth tactics. It is a practical way to answer a harder question:
When growth changes, what is actually driving it, what is merely correlated with it, and what should you investigate before scaling the wrong thing?
TL;DR
Growth marketing is useful when it helps a team connect the parts of growth that are usually reviewed in separate dashboards.
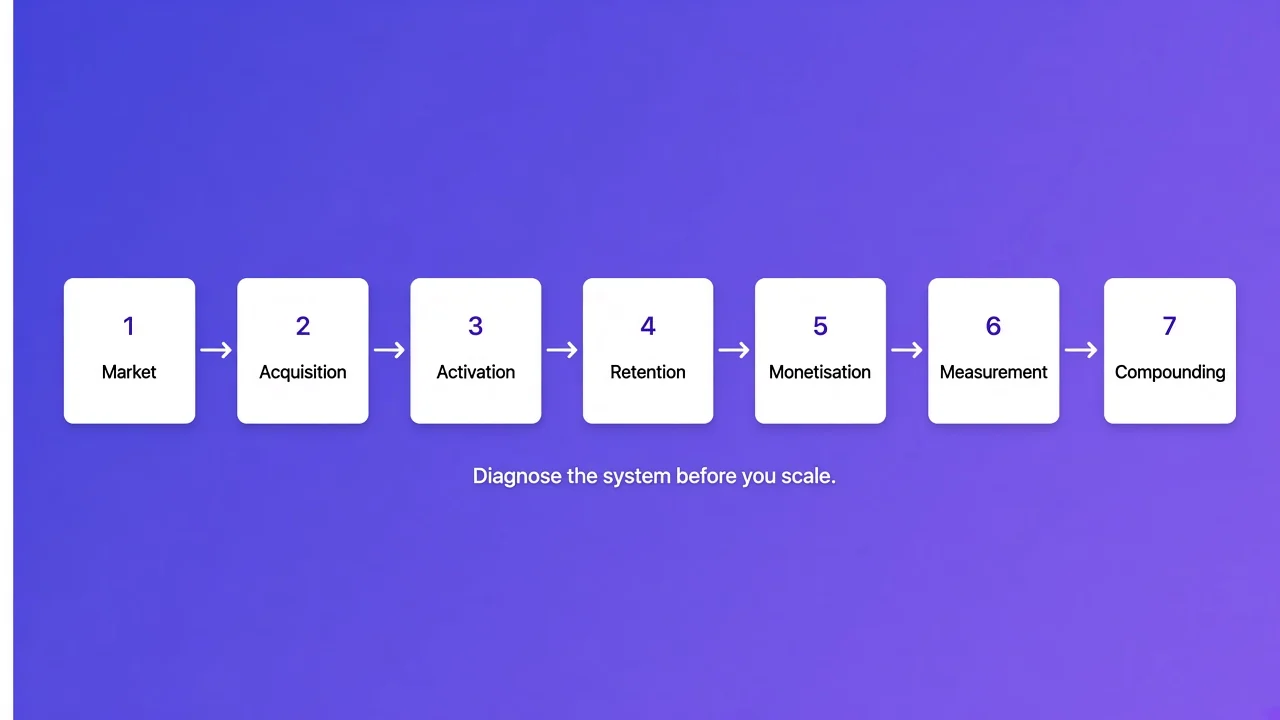
A practical map is:
Market & GTM → Acquisition → Activation & Value → Retention → Monetisation → Measurement → Compounding
But the map is not the insight.
The insight is that a metric can improve without the business improving.
A cheaper signup can be a worse customer. A promotion can create transactions without creating durable behaviour. Better activation can be meaningless if the event being optimised is not connected to value. Attribution can give a channel credit without proving that the channel caused the outcome.
So the operating job is:
- start from the business outcome
- trace what happened downstream by cohort
- find where the behaviour changed
- separate correlation from causal evidence
- identify the current constraint
- change one thing with a clear hypothesis
- re-diagnose the system after the result
If this guide gives you one habit, let it be this:
Do not scale a growth win until you know what happened after the metric that made it look like a win.
On this page
- What is growth marketing?
- The growth system
- Four checks before calling it a win
- Growth result review card
- Four data cuts before changing strategy
- The first 45 minutes when growth slows
- When a promotion creates volume
- Where this pillar goes next
- Frequently asked questions
- Sources and further reading
- About the author
The operating lesson behind this guide
In my own growth work across acquisition, lifecycle, referrals and analytics, I learned to distrust a result that only looks good at the first conversion point.
A campaign can look efficient at the click or signup level while downstream quality weakens. A lifecycle offer can create an immediate spike without telling you whether behaviour will repeat after the incentive disappears. A channel can receive attribution credit without proving that it created incremental demand.
That changed the question I ask first.
Not:
Which channel or tactic should we scale?
But:
What happened to the quality of the customer and the economics after the first visible conversion?
This is also why I prefer growth systems over growth-tactic lists. Tactics expire. The ability to diagnose what changed transfers across channels, products and markets.
What is growth marketing?
Growth marketing is a way of working that uses customer research, data, experimentation and cross-functional execution to improve measurable business growth across the customer lifecycle.
The useful distinction is not a particular list of channels. SEO, paid media, email, partnerships, product onboarding and lifecycle messaging can all be used in growth work.
What changes is the operating question.
A channel-first question sounds like:
How do we get more traffic, leads or customers?
A growth-system question is wider:
Are we reaching the right people, are they progressing toward value, are they staying, do the economics work, and which part of the system deserves attention now?
That wider scope is why growth work often crosses marketing, product, analytics, lifecycle, pricing, sales and customer experience.
The growth system
The model below is a practical map, not a universal industry framework. Different businesses will organise these stages differently.
| Layer | Core question | Useful signals |
|---|---|---|
| Market & GTM | Are we solving a meaningful problem for a reachable group, with a reason to choose us? | Demand evidence, ICP quality, positioning, win/loss patterns |
| Acquisition | Can the right people discover and enter the journey efficiently? | Qualified traffic, CAC, cost per qualified lead, channel mix |
| Activation & value | Do new users complete meaningful early behaviours and reach value quickly? | Activation rate, time to value, onboarding completion, key-event conversion |
| Retention | Do customers continue receiving enough value to stay or return at the right cadence? | Cohort retention, repeat rate, churn, frequency |
| Monetisation | Does the value created translate into sustainable revenue and margin? | ARPU, AOV, LTV/CLV, payback, margin, expansion |
| Measurement & learning | Can we tell what changed, what likely caused it and what to test next? | Funnels, cohorts, experiments, attribution, incrementality |
| Compounding | Does success make future growth easier, cheaper or more defensible? | Referral, word of mouth, organic demand, expansion, network effects |
The system is connected.
A retention improvement can increase customer lifetime value. That can change how much the business can rationally spend to acquire a customer. Better activation can improve the return on existing acquisition without buying another click. Better positioning can improve the quality of traffic before an onboarding experiment even begins.
This is why local optimisation can be misleading. A metric can improve while the business does not.
Before I call something a growth win, I want it to survive four checks
This is not an industry framework. It is a decision check I use to stop an exciting metric from becoming an overconfident conclusion.
- 1Metric improves
- 2Quality
- 3Durability
- 4Economics
- 5Causality
- 6Scale or do not scale
| Check | Question | Example of a false positive |
|---|---|---|
| Quality | Did we attract or create a better customer outcome, not just more activity? | Signups rise, but the new cohort activates and retains worse |
| Durability | Does the behaviour continue after the campaign, incentive or novelty disappears? | A promotion creates a transaction spike that vanishes immediately after the offer ends |
| Economics | Did the improvement survive CAC, margin, payback and cost-to-serve? | Revenue rises while contribution margin and payback deteriorate |
| Causality | How confident are we that our intervention created the outcome? | ROAS improves because a channel receives credit for demand that already existed |
A result does not need perfect evidence on all four checks before a team can act. Small, reversible decisions can be made with weaker evidence.
But the larger and less reversible the decision, the less comfortable I am scaling from a single dashboard metric.
Common false positives
| What improves | What I would refuse to conclude yet | What I would inspect next |
|---|---|---|
| CPC or CPM | Acquisition is more efficient | Activation and retained conversion by source |
| Signup conversion | The landing page is better | Qualification, activation, cohort retention |
| Activation | Onboarding is solved | Time to value and retained usage |
| Retention | Product value improved | Incentives, margin and behaviour after the incentive disappears |
| ROAS | The channel caused the revenue | Incrementality, holdouts, assisted journeys |
| Revenue | Growth is healthy | Margin, payback, cohort quality and repeat behaviour |
The numbers can all be useful. The mistake is asking one of them to answer a larger business question than it contains.
A copy-paste growth result review card
Use this whenever a campaign, offer, product change or channel reports a meaningful improvement.
GROWTH RESULT REVIEW

1. Business outcome we actually care about:
2. Metric that moved:
3. Cohort / segment affected:
4. What changed in absolute volume:
5. QUALITY: What happened downstream to customer quality?
6. DURABILITY: Did the behaviour persist after the intervention?
7. ECONOMICS: What happened to CAC, margin, payback or LTV/CLV?
8. CAUSALITY: What evidence suggests we caused the outcome?
9. Strongest alternative explanation:
10. Evidence that would prove our preferred explanation wrong:
11. Smallest next test:
12. Decision if the test succeeds:
13. Decision if the test fails:
The card is deliberately uncomfortable at points 9 and 10.
Growth reviews often become exercises in explaining why the thing we already want to scale is working. Asking for the strongest alternative explanation and the evidence that would falsify our preferred story forces the analysis in the opposite direction.
If the team cannot answer those questions yet, the honest output is not “scale” or “stop.”
It is:
We do not know enough yet. Here is the cheapest evidence that would reduce the uncertainty.
The four data cuts I want before changing the growth strategy
When a team says growth has improved or slowed, I would want four views before recommending another channel, campaign or product change.
1. Acquisition source or offer → activation
Which sources, campaigns, offers or segments produced people who completed a meaningful early behaviour?
This separates volume from quality.
2. Activation → retained behaviour
Of the people who activated, which cohorts continued receiving or creating value at the cadence that makes sense for the product?
This tests whether activation is a useful proxy rather than a convenient event.
3. Retained behaviour → economics
What happened to revenue, contribution margin, LTV/CLV assumptions and payback for those cohorts?
This prevents a growth story from ending at engagement when the business model is getting weaker.
4. Attribution → causal confidence
Which outcomes are merely credited to a channel, and which have stronger evidence of incrementality?
Not every business can run a perfect experiment for every decision. The point is to know the strength of the evidence before acting as if attribution equals causality.
If you cannot produce one of these views, that is useful information too. The measurement gap may itself be limiting the quality of the growth decisions.
How to use the map
The system map is not a checklist that every company should optimise in the same order.
Use it to trace the relationship between:
who enters → whether they reach value → whether value repeats → whether the economics work → how confident you are about the cause
The useful question is not “Which stage has the lowest percentage?”
It is:
Where did the mechanism of growth change, and what evidence would distinguish the competing explanations?
That is the point where analysis should turn into a test.
My first 45 minutes when growth slows
If a meaningful growth outcome moved tomorrow, I would resist opening a channel dashboard first. I would spend the first pass working through this sequence before creating a new campaign brief, changing pricing or asking for another acquisition channel.
Step 1: Pick the business outcome that actually deteriorated
Examples:
- retained customers
- retained revenue
- contribution margin
- repeat purchase or transaction rate
- qualified pipeline
- payback
Do not start from the loudest dashboard alert unless it is the actual business outcome.
Step 2: Compare cohorts, not only totals
Split the change by dimensions that could plausibly explain it:
- acquisition source
- campaign or offer
- new vs returning
- customer segment
- geography
- product or plan
- signup or purchase period
Blended averages often hide the cohort where the problem started.
Step 3: Find the first meaningful break in the journey
Move backwards from the business outcome.
If retained revenue fell, ask whether the change began in retention, activation, customer quality, pricing, acquisition mix or something external.
The first metric that moved is not automatically the root cause, but it gives you a place to investigate.
Step 4: Write the mechanism as a falsifiable sentence
For example:
Paid search is bringing lower-intent customers, which is why signup volume is up but activation and 30-day retained behaviour are down.
That is better than:
Paid traffic quality feels worse.
A useful hypothesis says what changed, why it should affect the outcome, and what evidence would prove it wrong.
Step 5: Decide what evidence is strong enough for the decision
A dashboard correlation may be enough to investigate.
It may not be enough to reallocate a large budget.
For high-impact decisions, look for stronger evidence through cohort comparisons, controlled experiments, holdouts, geo tests or other appropriate causal methods.
Step 6: Change the smallest thing that can test the mechanism
Do not rewrite the whole growth strategy when one targeted test can tell you whether the diagnosis is right.
Step 7: Re-diagnose after the result
The constraint can move.
Fixing activation can expose a retention problem. Improving retention can make a previously expensive acquisition channel viable. Better measurement can reveal that the apparent channel problem was an attribution problem.
Growth diagnosis is therefore a loop, not a one-time audit.
A worked example: when a promotion creates volume
Consider a hypothetical cross-border payments product running a limited-time rate promotion.
Transaction volume rises during the campaign.
The easy conclusion is:
The promotion worked.
That statement is incomplete.
A useful growth review would ask:
- How much of the volume came from first-time customers versus existing customers?
- Did first-time customers transact again after the promotion ended?
- Did previously inactive customers return, or did already-active customers simply transact sooner?
- Did the promotion change transfer size, frequency or contribution margin?
- Was the campaign creating incremental transactions, or subsidising transactions that were likely to happen anyway?
- Did the offer attract customers who behaved differently from non-promotional cohorts?
- What happened to those cohorts after the incentive disappeared?
I have had to think about this exact class of problem in fintech and lifecycle work. A promotion gives you a very visible event, which makes it tempting to treat the spike as the outcome.
But there are at least four different things the same spike could mean:
- Acquisition: genuinely new customers entered and stayed.
- Reactivation: dormant customers returned.
- Timing shift: customers transferred earlier than they otherwise would have.
- Subsidy: customers who would have acted anyway received an incentive.
Those outcomes have very different implications for whether the promotion should be repeated or scaled.
This is the difference between reporting activity and diagnosing growth.
Growth marketing vs performance marketing and digital marketing
These terms overlap, and companies use them differently.
Digital marketing describes marketing through digital channels such as search, social, email, content and online advertising.
Performance marketing usually emphasises measurable response and efficient outcomes from campaigns or channels.
Growth marketing is better understood as an operating approach that uses channels, product surfaces, lifecycle communication, data and experimentation across a broader part of the customer journey.
The distinction is therefore less about which channel is allowed and more about the scope of the problem being owned.
What should a growth team optimise first?
There is no universal order.
If new users rarely reach value, scaling acquisition can amplify waste. If activation and retention are healthy but too few qualified customers discover the product, distribution may be the constraint. If demand and retention are healthy but payback is too long, pricing, margin or monetisation may deserve attention first.
A practical rule is:
Find the constraint that most limits sustainable growth, improve it, then diagnose the system again.
The constraint can move.
Where this pillar goes next
This Growth & Marketing pillar is organised around three deeper guides.
How Growth Actually Works
A deeper look at acquisition, activation, retention, revenue, referral, funnels, loops and the mechanics that make growth compound.
Go-To-Market Strategy
How to connect market selection, ICP, Jobs to Be Done, positioning, messaging, pricing and distribution into a coherent route to market.
Retention Is Growth
How onboarding, cohorts, lifecycle communication, CRM, churn, reactivation and customer value shape the system after acquisition.
Supporting guides will go deeper into topics such as AARRR, growth loops vs funnels, CAC and LTV, North Star Metrics, experimentation, ICP, positioning, CRM segmentation, churn and lifecycle messaging.
Where this model can fail
A framework can organise a problem, but it can also create false confidence.
Not every growth problem lives neatly inside a customer lifecycle.
Macroeconomic shifts, regulation, operational capacity, product quality, market timing, brand trust, competition and distribution power can dominate the outcome. Some businesses also have naturally episodic usage, which makes conventional retention windows misleading.
Measurement has limits too. Attribution is model-dependent. Experiments have design constraints. Observed correlations do not automatically establish causality. Customer behaviour changes.
The point of a growth system is not to make the business look mathematically tidy.
It is to make the assumptions visible enough to challenge.
The idea to keep
Growth work becomes more useful when the team stops asking whether an isolated metric improved and starts asking whether the system became healthier.
That requires following the customer farther than the first conversion.
It requires separating volume from customer quality, activation from value, attribution from incrementality, revenue from economics and short-term response from durable behaviour.
The question I would keep on the wall is:
What would have to be true for this growth result to be genuinely good for the business?
Then go find the evidence.
That is more durable than collecting tactics.
Frequently asked questions
What is growth marketing in simple terms?
Growth marketing is a data-informed, experimental approach to improving growth across more of the customer lifecycle than acquisition alone. It looks at how people are acquired, how they progress toward value, whether they stay, how the economics work and what evidence should guide the next decision.
What is a growth marketing strategy?
A growth marketing strategy explains where sustainable growth is expected to come from, which customers matter, which parts of the lifecycle are most important, which constraints deserve attention and how the team will measure whether its choices worked.
It is more useful as a set of choices and hypotheses than as a long list of tactics.
What is the difference between growth marketing and growth hacking?
The terms overlap, but growth hacking is usually associated with fast, tactical experiments and short feedback loops. Growth marketing is generally used more broadly for a repeatable, longer-term system involving acquisition, activation, retention, monetisation, experimentation and measurement.
Should a startup focus on acquisition or retention first?
There is no universal answer. If users arrive but fail to progress toward value or return, more acquisition can increase waste. If activation and retention are healthy but too few qualified customers discover the product, acquisition may genuinely be the constraint.
The decision should follow evidence about the current bottleneck, not a fixed rule.
Which metrics matter most in growth marketing?
There is no universal growth dashboard.
Start with the business outcome you are trying to improve, then choose leading and lagging metrics that explain the current constraint. Depending on the business, those might include qualified acquisition, CAC, activation rate, time to value, cohort retention, churn, LTV/CLV, payback, contribution margin, referral, expansion or incremental revenue.
A metric is useful when it changes a decision.
Sources and further reading
- LinkedIn Ads: Growth Marketing: What It Is and Why It Is Important
- Amazon Ads: Growth Marketing
- Reforge: Building Growth: Product, Process, and Team
- Reforge: Growth Loops Are the New Funnels
- Reforge: Growth Strategy
- Amplitude: What Is Product Analytics? A Data-Backed Guide
- Amplitude: Time to Value: The Key to Driving User Retention
- Mixpanel: What Is User Retention and How to Analyze It
- Stripe: Customer Lifetime Value (CLV): What It Is and How to Improve It
- Stripe: CAC in SaaS: How to Calculate, Benchmark, and Improve Customer Acquisition Cost
- Google: How Experimentation and Incrementality Testing Reveal the True Value of Marketing
- Google Ads Help: Understand Incremental Conversions and Attributed Conversions
- HubSpot: What Is a Go-to-Market Strategy?
- Google Search Central: Creating Helpful, Reliable, People-First Content
- Google Search Central: Guide to Optimizing for Generative AI Features on Google Search